This is the sixth and final post in a series on my Clojure workflow.
In my last post, I introduced Marginalia as a tool for (semi-)literate programming. Here are some tricks I’ve used to make Marginalia work for me — in particular, to support a style of working with investigatory “notebooks.” As always, your mileage may vary.
Problem: I want to reorder my code snippets to allow for more natural exposition.
Solution: As discussed, Marginalia does not
provide reordering or interpolation of source code in the same
way that Knuth’s WEB does. By default, lein marg
processes all the Clojure source code in your project except in
the test directory, presenting namespaces in alphabetical
order. The problem is exacerbated by the one-pass Clojure
compiler, which expects everything to be declared before it is
used.I have been able to work around this to my satisfaction by
specifying directories and/or files at the command line in the
order I want them to appear. For example, if I wanted both src and test files in my output, and if
I wanted src/myproject/core.clj to appear first, I
would saylein marg src/myproject/core.clj src test
If I wanted to reorder forms within core.clj, I could also just
use Clojure’s declare macro to forward-declare the
vars at the top of the file. This is far from the power of
Knuth’s WEB, but it’s been good enough for me.
Problem: I want to see my Marginalia output as soon as I save my source code.
Solution: It’s nice to have quick feedback, so I
use conttest to run lein marg, plus some Applescript (or equivalent) to reload the output in
the browser.
Example:
conttest 'lein marg && \
     osascript ~/bin/reload-browser.scpt \
     file:///path/to/project/docs/uberdoc.html'
The Applescript ~/bin/reload-browser.scpt is fairly simple,
though you may have to adjust to suit your browser of choice:
on run argv
    tell application “Google Chrome”
        set URL of active tab of first window to item 1 of argv
    end tell
end run
Though it does take a few seconds, Marginalia not being a speed demon, one can get pretty quick visual feedback using this approach.
Problem: I want to show expressions and the results of their evaluation together, a la iPython Notebook, Mathematica, Maple, Gorilla REPL, or Session.
Solution: For Clojure evaluation, I use the cider-eval-last-sexp-and-append trick I described in my previous post on customizing Emacs. This results in something like the following, in Emacs and in Marginalia:
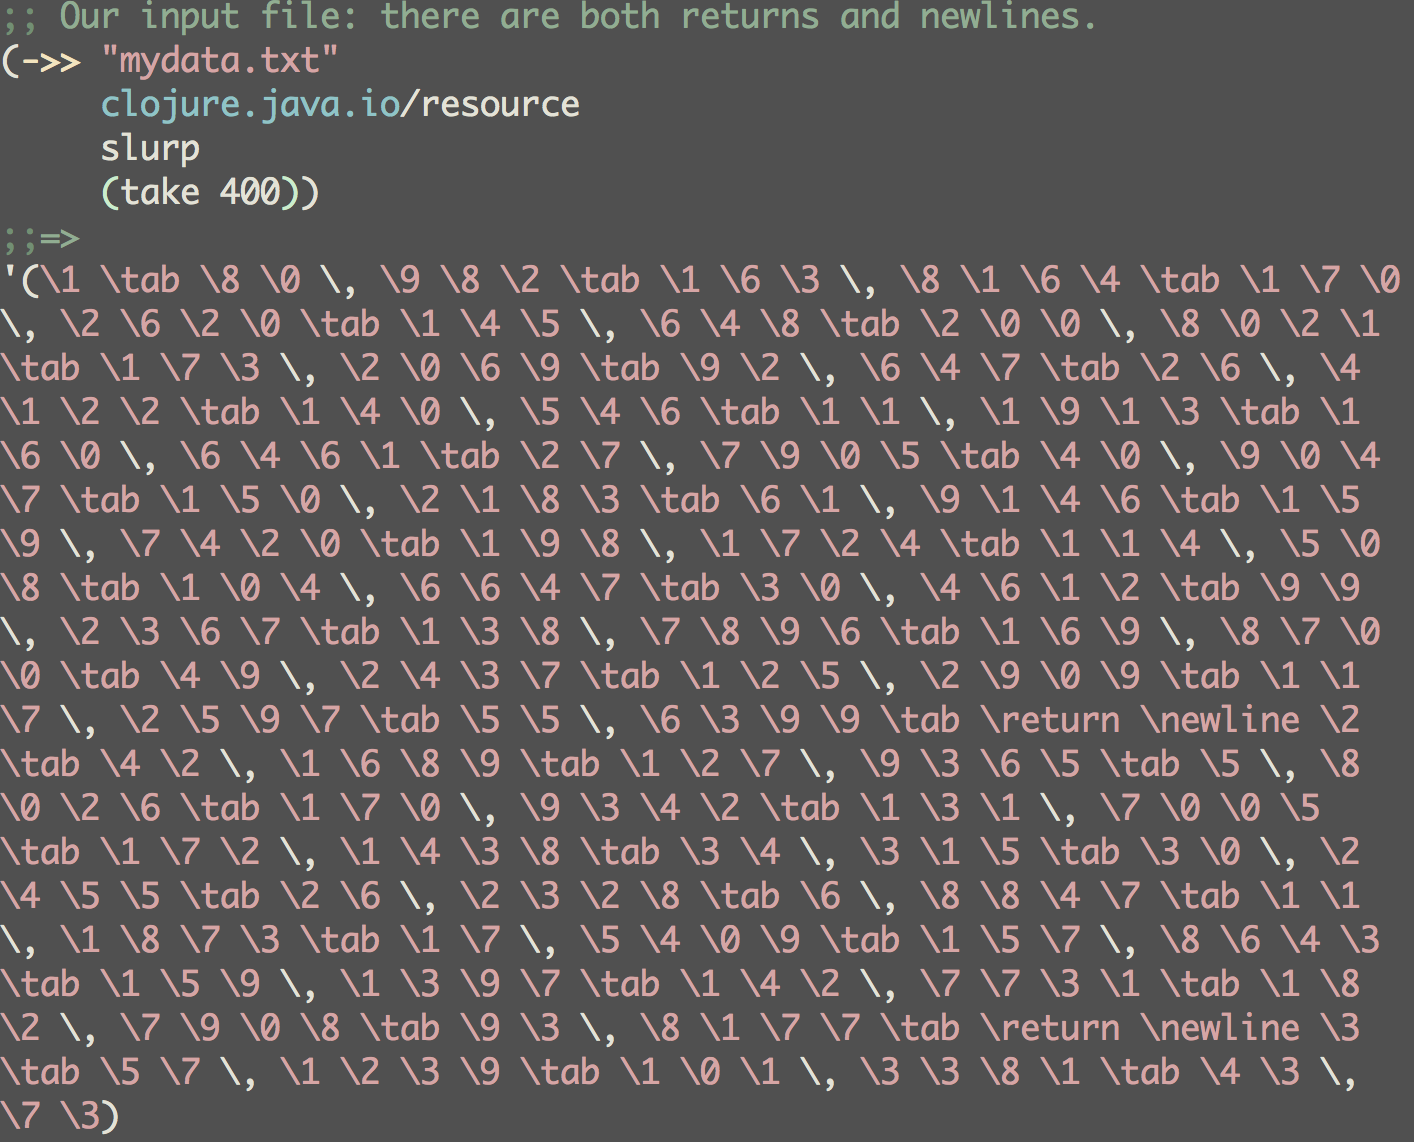
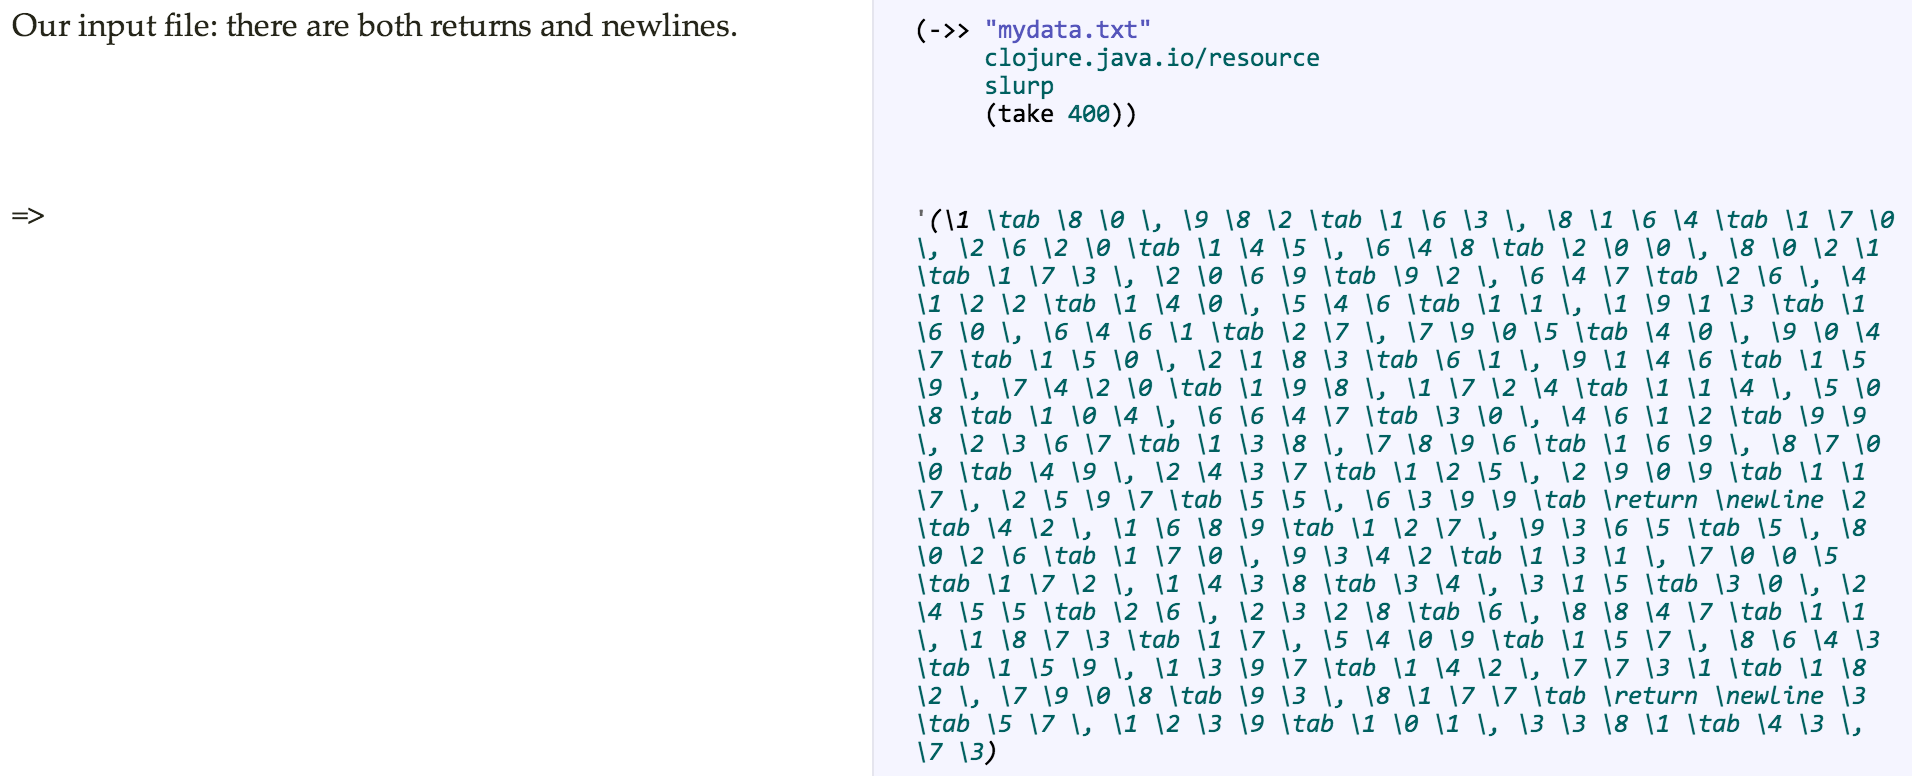
Here I added a single quote (') to keep the
resulting form from throwing an exception when the buffer is
recompiled. This not quite iPython Notebook, but I find it gets
me surprisingly far. And the source code remains completely
usable as a whole, standalone program. This means I can combine
notebook-style investigations directly in a working project
without worrying how, eventually, to get the annotated code into
production.
Problem: I want nice looking math formulae in my “notebook.”
Solution: Use the MathJax JavaScript library.
As shown in the images from the previous post, math can be typeset quite nicely with MathJax. This can either be imported directly from a CDN, as follows:
;; <script type="text/javascript”
;;  src="http://cdn.mathjax.org/mathjax/latest/MathJax.js?config=TeX-AMS-MML_HTMLorMML">
;; </script>
(this being done directly in the Clojure source file, comments
being rendered as Markdown, and therefore HTML). Or, copy down
the MathJax JavaScript source and use the -j argument to lein marg.
It took me a little time to figure out how to properly escape
the TeX for inline math formulae. The usual pattern in HTML is to
use \( and \), as follows:
\(r^2 = x^2 + y^2\)yielding \(r^2 = x^2+y^2 \) inline.
For this to work correctly, Marginalia makes you add another \:
\\(r^2 = x^2 + y^2\\)For inset math formulae, the required $$ is unchanged:
$$r^2 = x^2 + y^2$$Which gives:
$$r^2 = x^2 + y^2.$$
Problem: I want to show graphs along with my text, code, and mathematics.
Solution: Use a JavaScript plotting library, and a little Clojure to prepare the data.
This last hack is perhaps the most fun and the most “hacky” of the bunch. One of the best features of notebook solutions like iPython Notebook is the ability to show graphs inline with the code that generates them. This is not really in the wheelhouse of Marginalia, which was meant as a static documentation tool, but since we can incorporate JavaScript (as seen above, for mathematics), we can leverage existing plotting libraries. I use i3d3, an open-source JavaScript plotting library built on top of d3.js.
The only obvious difficulty is how to get the data points into the browser for JavaScript to plot. For this, we need to do the following:
- Using the REPL, capture the Clojure data, format it as
JavaScript, and write to a disk file in the project,
local.js. - Load the resulting local.js, as well as any other needed libraries (in my case, d3, i3d3, and underscore.js) as part of the Marginalia command.
The Clojure for Step 1 is shown in this gist. The i3d3 function, evaluated in the REPL, does the work of preparing the data on disk. The intermediate JavaScript file looks something like this:
// BEGIN DIV plot2
i3d3.plot({"ylabel":"Entries",
           “xlabel":"Priorities",
           “size":[700,250],
           “data":[{"type":"bars",
                      “bins":[93991,103924,3396],
                      “color":"grey",
                      “range":[0,4]}],
           “div":"plot2"});
// END DIV plot2
(Multiple DIVs are supported in a single file by changing the DIV ID for each i3d3 function call in the REPL).
The command to continuously run Marginalia (Step 2) is:
conttest “lein marg src/liveana/core.clj \
         -c style.css \
         -j 'd3.v3.min.js;underscore-min.js;i3d3.js;local.js' \
         && osascript ~/bin/reload-browser.scpt \
                      file://path/to/docs/uberdoc.html”
Here I have put the JavaScript libraries in the docs/ directory in advance; also, since i3d3 benefits from a style
sheet, that is prepared and included in the Marginalia shell
command as well.
Here’s an example plot, from this notebook:
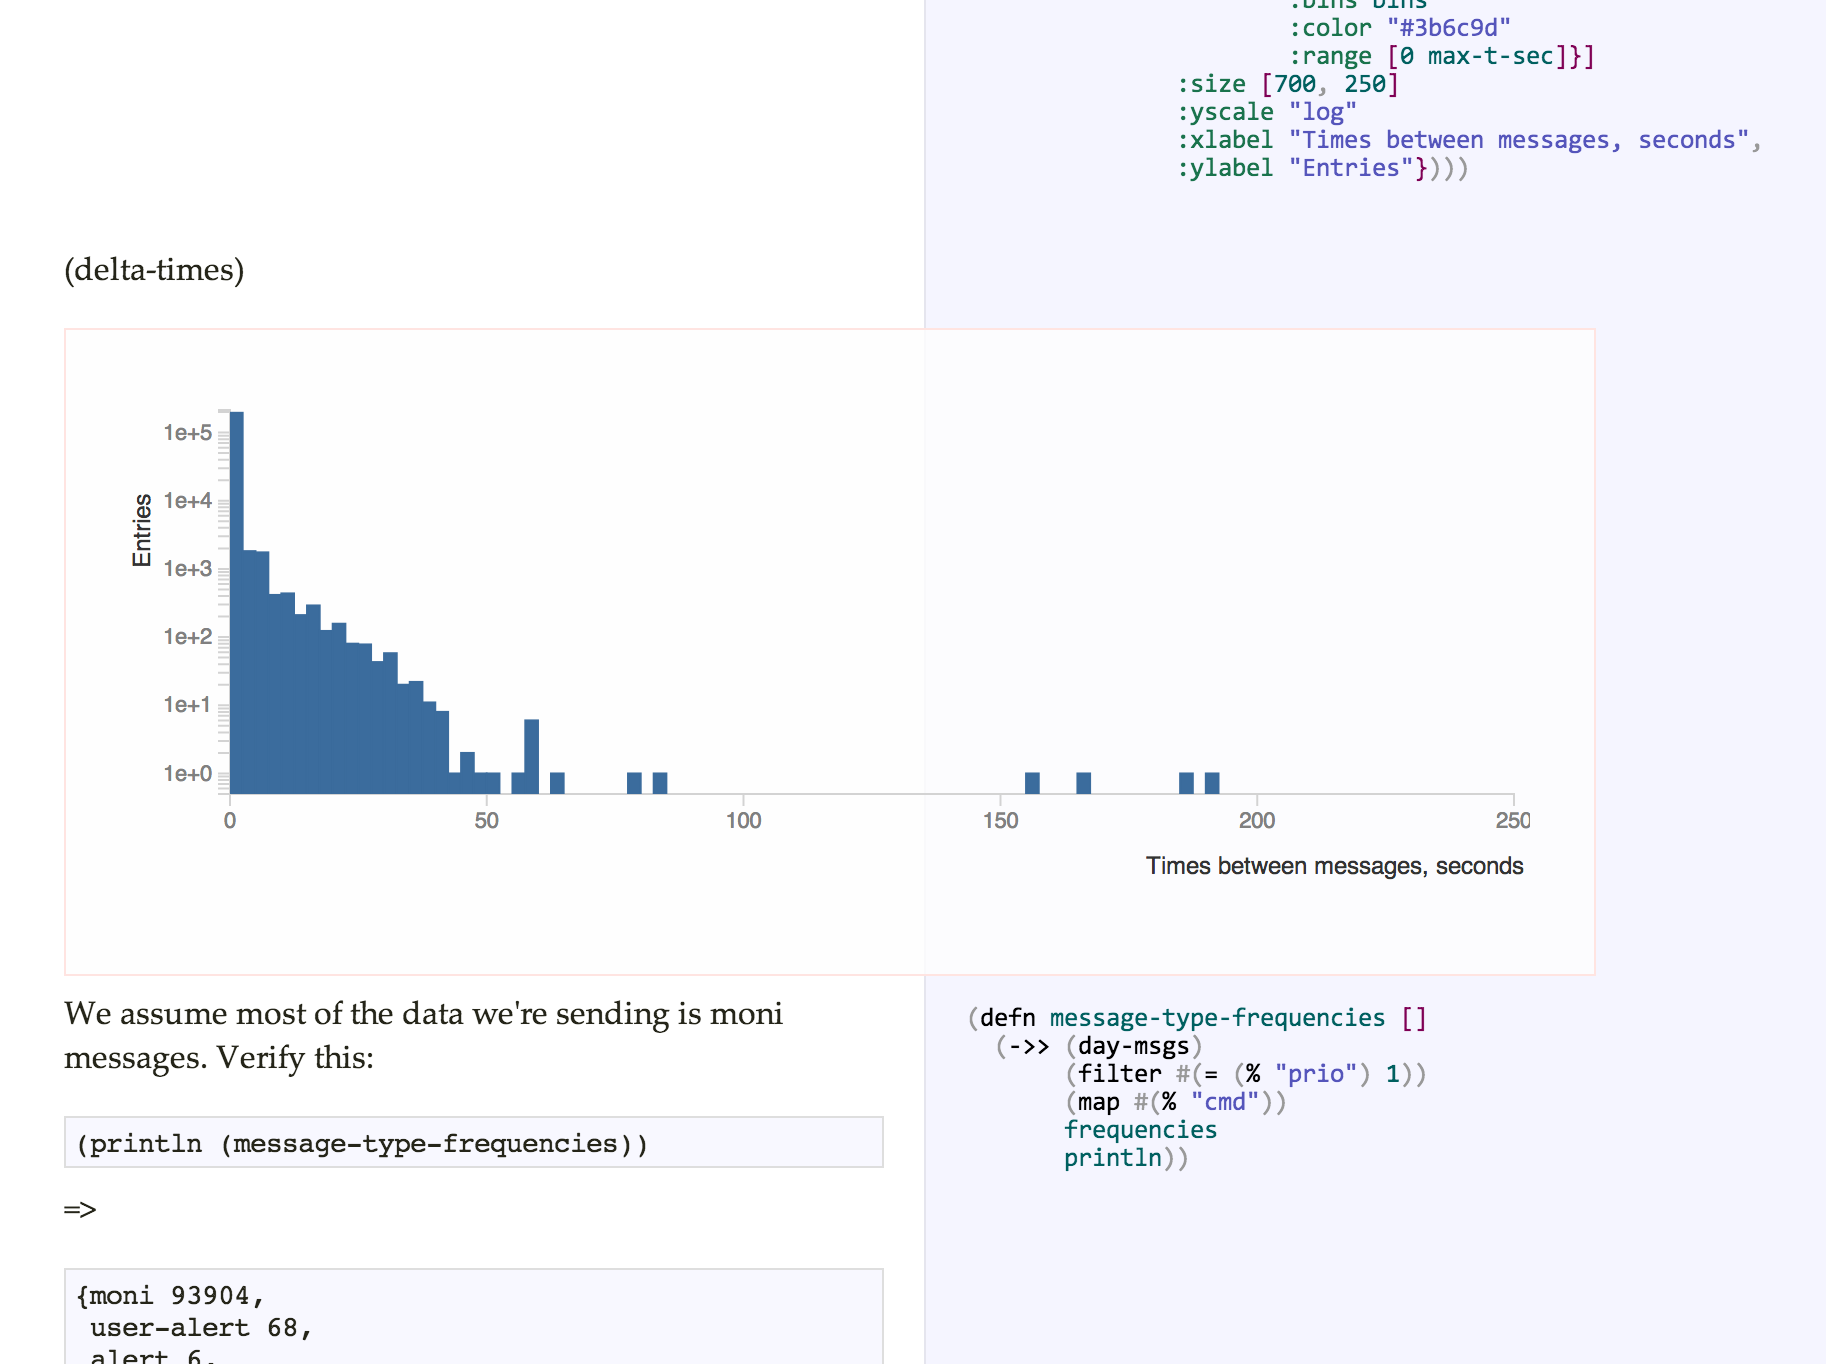
I told you it was hacky, but give the example a whirl anyways. Since i3d3 supports panning and zooming, that comes for free!Thanks to John Kelley / WIPAC for permission to show this work in this post.
As tools like Gorilla REPL and Session become more popular and powerful, I may discard this way of injecting graphs into “literate” programs. But I did want to see how far I could push Marginalia as a Clojure-based substitute for iPython Notebook, and found this approach surprisingly powerful. I might package it into something a bit more off-the-shelf if anyone else shows interest.
This concludes the series of posts on Clojure workflows—thanks to any of you who made it this far! The Clojure tooling landscape is constantly shifting, and I continue to learn new tricks, so things may look different a year from now. In the mean time, perhaps some people will find something helpful here.
Happy hacking!